Nebelmesser's Playground
Experiments in visualization
Hilbert Clock
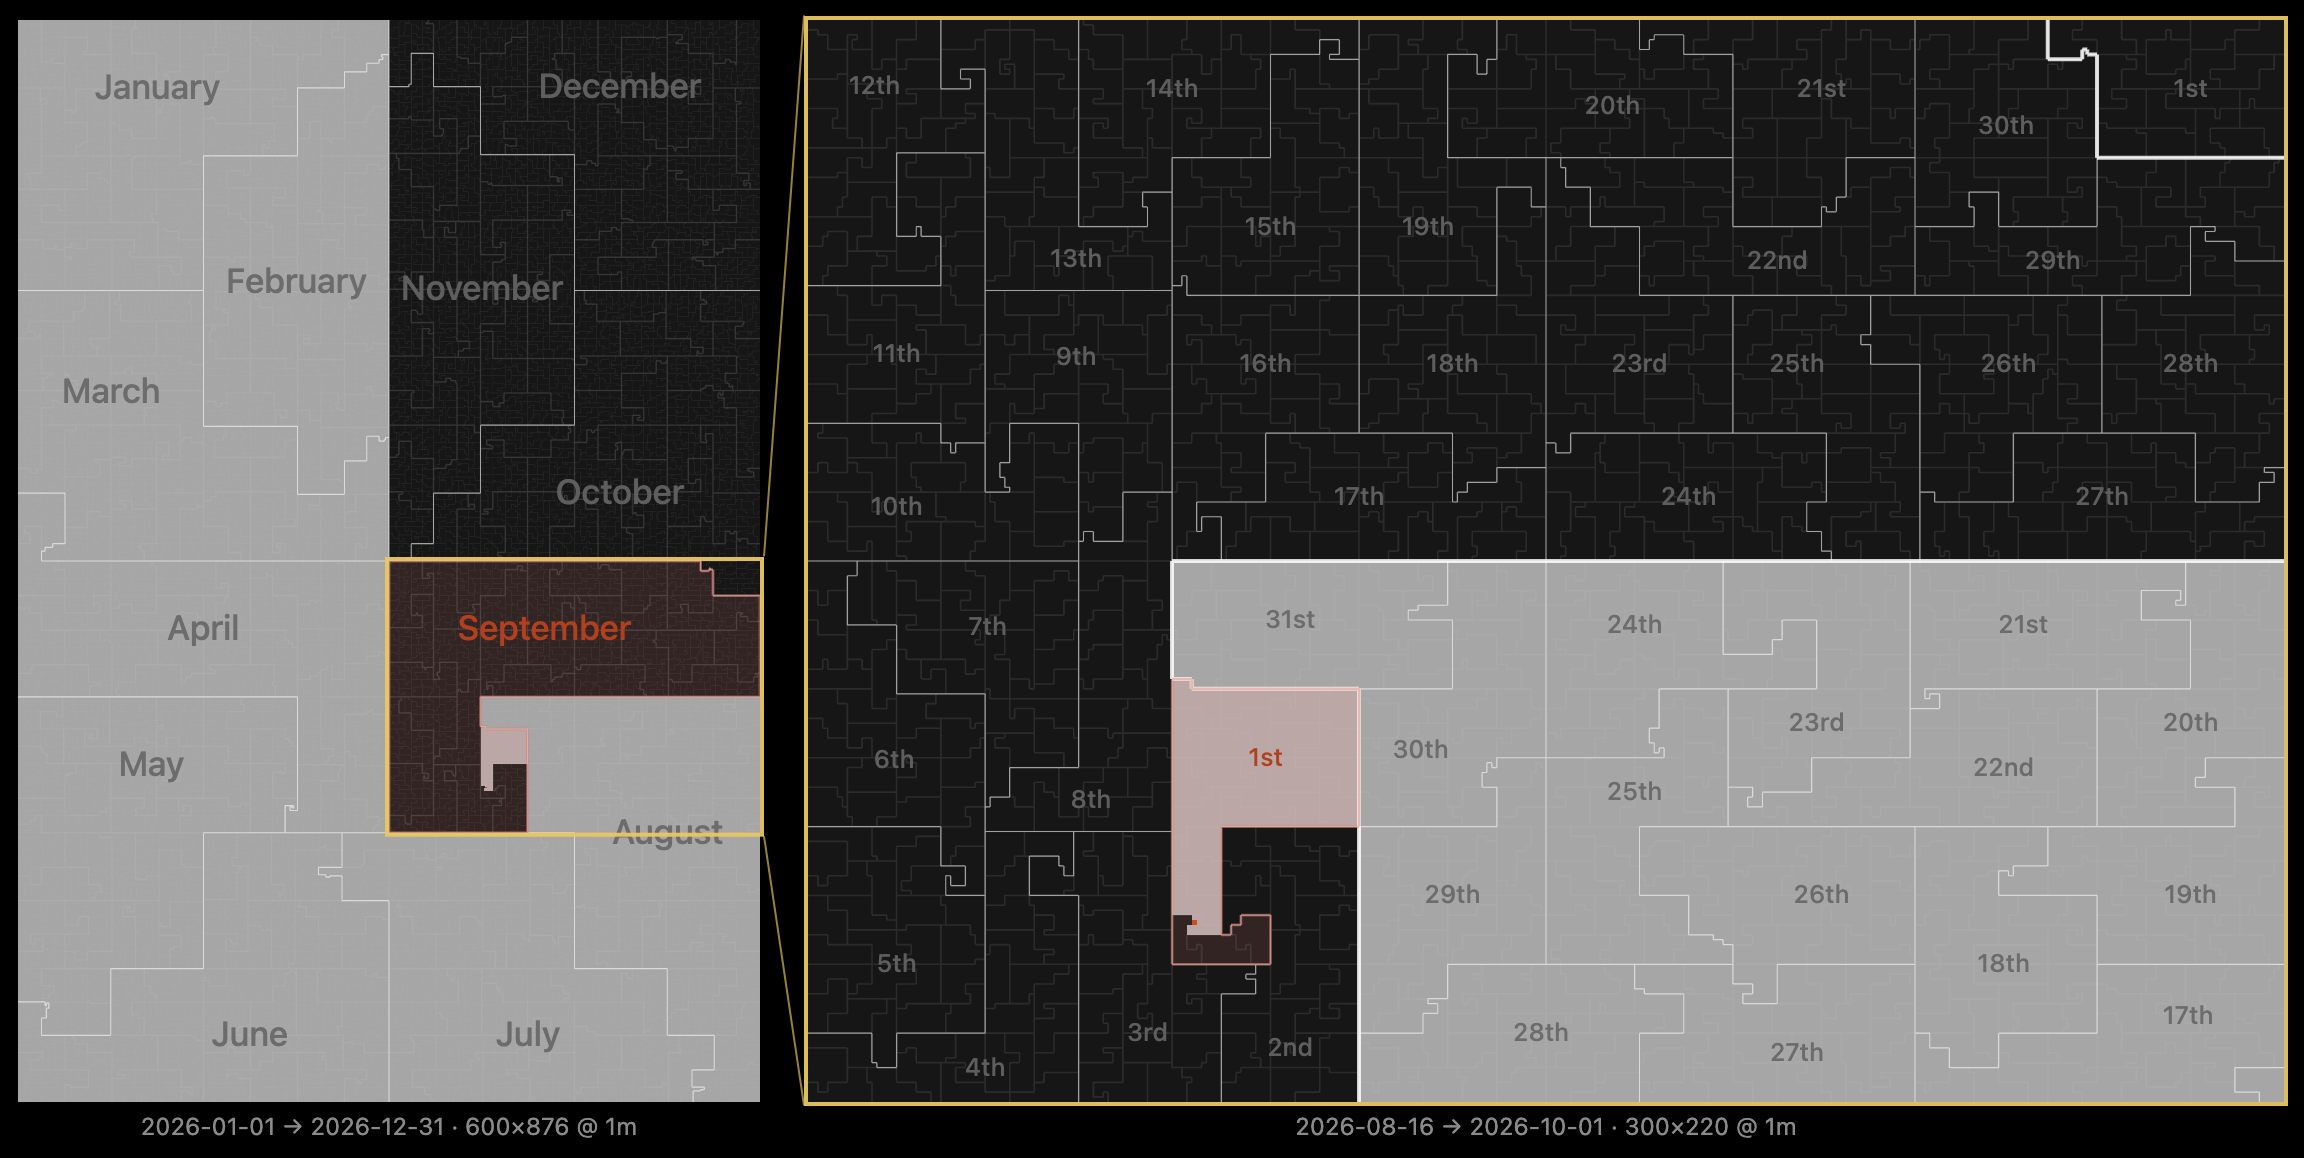
A single-file clock that draws a time range as a 2D space-filling curve.
Open the live map
or the local hilbert/clock.html — no build step, no dependencies, no network.
Time runs along a generalized Hilbert curve (“gilbert”, so non-power-of-two grids work too), one cell per time step. Cells that are consecutive in time stay adjacent on screen, so an interval always shows up as a compact blob rather than a scattered set of pixels.
Inspiration

Ranges
D / M / Y are the current day, month and year and follow the wall clock
(they roll over at midnight). Unix is 0 … 2038-01-19, the signed 32-bit epoch,
which is exactly 2³¹ seconds and therefore lands on a clean square grid.
Range opens two date inputs for a custom interval; when a custom range ends,
it advances to the next window of the same length.
The grid (w × h and the duration of one cell) is picked per range by a scoring
pass that balances the aspect ratio of the available space, the number of cells,
leftover cells, and whether a parent cell can still be refined down to ≤ 1 s.
Zoom
A second panel refines one block of the parent map: the yellow box marks a
Hilbert-tree leaf around now, diagonals connect it to the inset, and each
parent cell inside it is subdivided into k × k sub-cells so the inset can get
down to sub-second resolution. + and − step through tree depths, i.e. pick a
bigger or smaller yellow box. On the day view, zooming out past the coarsest
step dismisses the inset and leaves a single panel.
Both panels are laid out to fit the viewport without scrolling — side by side or stacked, whichever gives more map area (portrait always stacks).
Keyboard
| Key | Action |
|---|---|
D M Y U, R |
day / month / year / Unix epoch / Range |
+ − or ↑ ↓ |
zoom in / out |
F or double click/tap |
hide the top bar |
Notes
- The selected range, custom dates and zoom level per range are kept in
localStorage. ?time=YYYY-MM-DD-HH:MM:SSstarts the clock at a given moment (it keeps ticking from there) — handy for screenshots and debugging.?speedup=Xspeeds up rendering X times- All colors and most tunables are CSS custom properties in
:root; the JavaScript reads them, so retheming means editing the stylesheet only.
License
MIT. Made by Nebelmesser.